 HIPAA Compliant
 ISO 27001 Certified
What a clinical trial recruitment dashboard should show sponsors in real time
Adding a site in month three of a twelve-month enrollment period is a routine operational change. Adding a site in month ten to catch up is an expensive salvage operation. Same decision, different windows, different costs. The gap between them is almost always visibility.
A recruitment dashboard is supposed to close that gap. Most do not. They show accurate numbers that arrive too late to act on, or the wrong numbers, or aggregates that hide the point where the trial is actually breaking. The useful question is narrower than whether the data is real-time. It is whether the specific things a sponsor needs to see are visible while the decision window is still open.
The recruitment decisions sponsors lose when visibility lags
Every recruitment period turns on a small number of decisions. Add sites. Reallocate outreach. Escalate to an underperforming site. Broaden a screening criterion after a run of screen failures. Rebalance recruitment across demographic subgroups before the composition drifts.
Each decision has a window. Once it closes, the option is gone or the cost of taking it climbs sharply. The site-addition example above is one version of this pattern. The screen-failure example is another: adjusting outreach targeting or working with a site on eligibility screening is straightforward in month four and painful in month nine, when the protocol amendment cycle starts to overlap the enrollment window.
Visibility that arrives late is not a data quality problem. It is a decision structure problem. It does not go away by adding more metrics to a monthly report. It is addressed by making the right information visible while the decision window is still open. The hidden cost of slow recruitment in clinical trials traces how time-to-first-patient compounds when early signals stay buried in reporting cadence.
Enrollment pace against plan, not just enrollment count
Sixty percent enrolled means nothing on its own.
It could be ahead of plan. It could be behind. The count carries no directional information until the timeline is applied. If sixty percent enrolled represents seventy percent of the enrollment period elapsed, the trial is behind. If it represents forty percent elapsed, it is ahead. Sponsors reading only the running total are answering the wrong question.
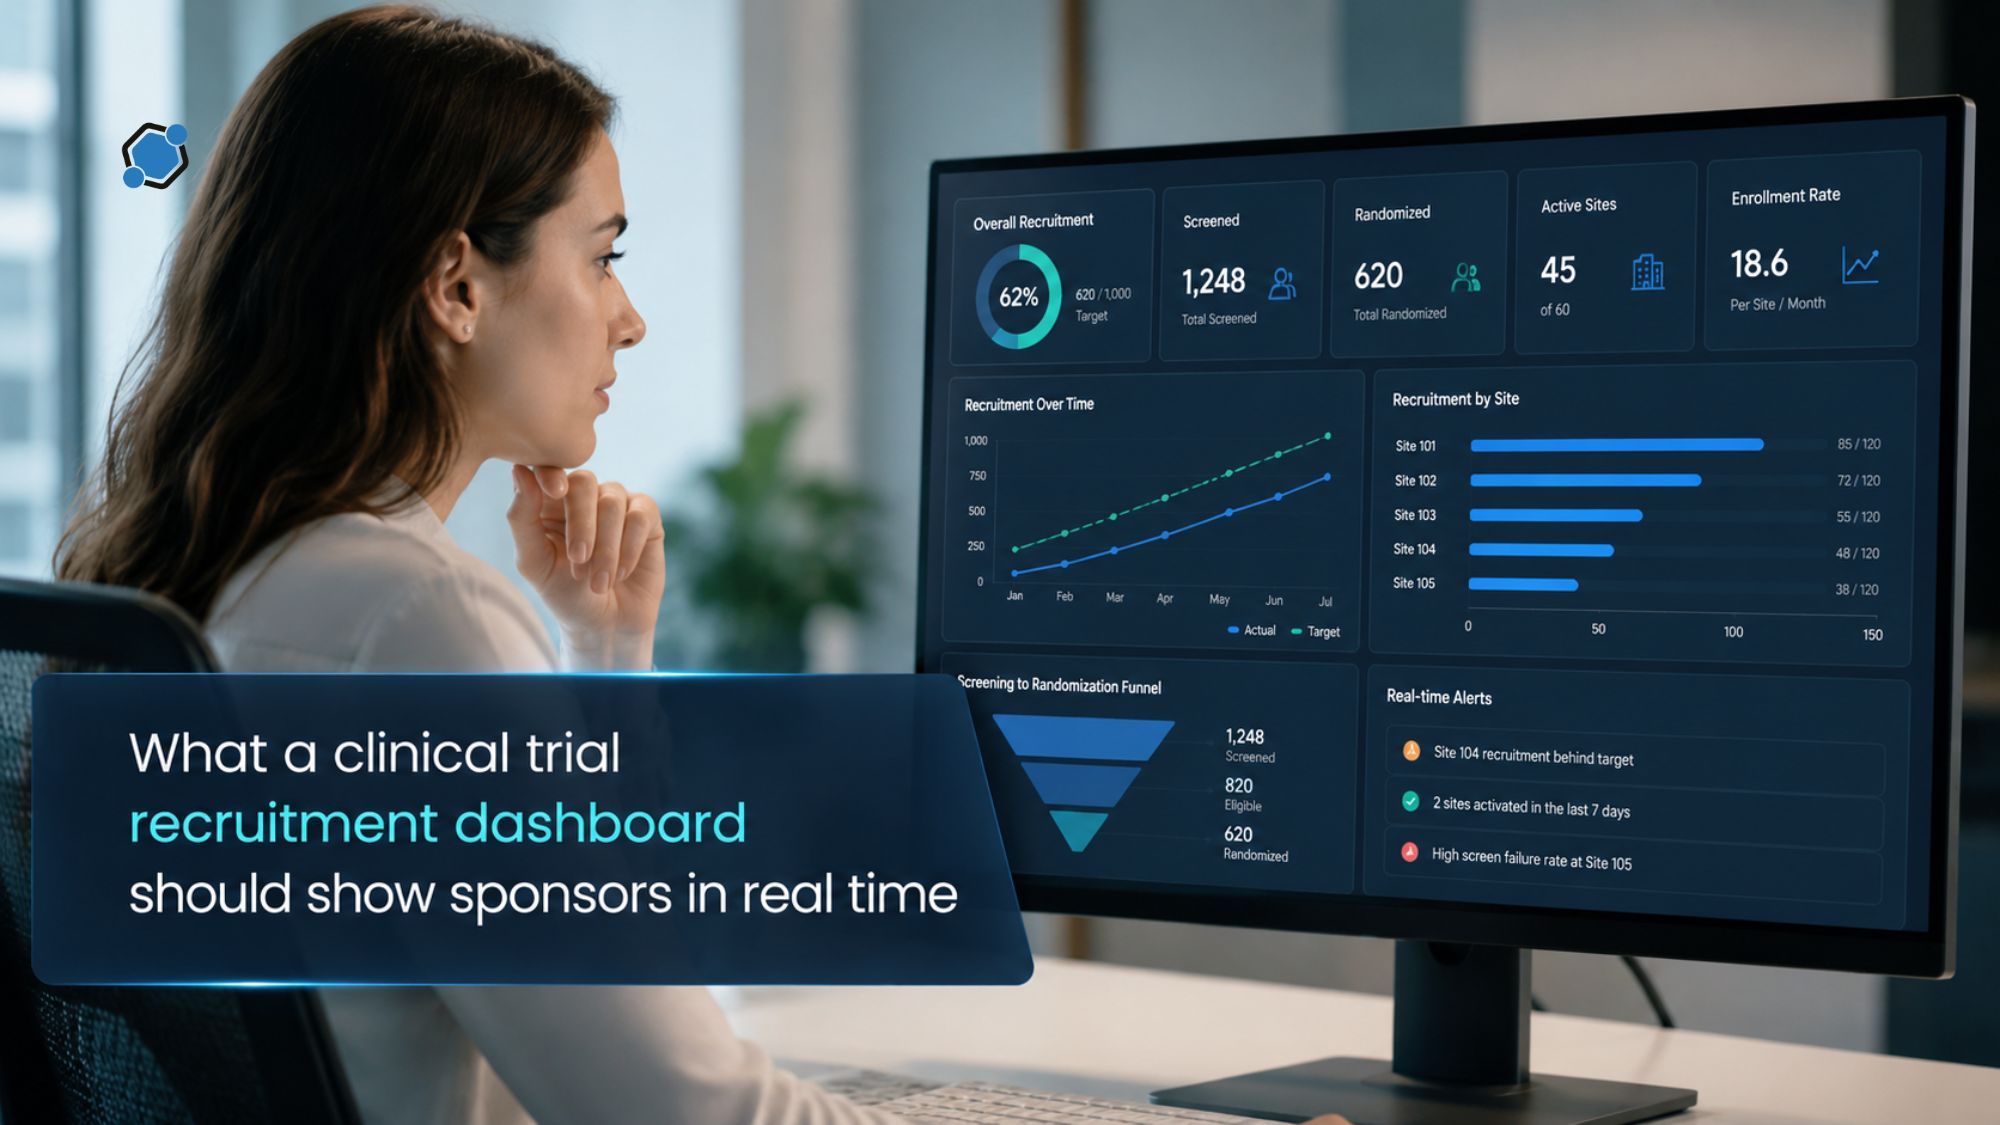
A dashboard that supports the actual decision holds both curves at once: the planned enrollment trajectory as a function of time, and the actual trajectory tracked against it. It projects forward from current pace, so the question shifts from what has been enrolled to whether the current trajectory still hits database lock. Dashboards that transform sponsor oversight cover how the sponsor view changes when the underlying frame shifts from reporting to forecasting.
Funnel drop-off between pre-screen and randomization
Enrollment is the end of a funnel. Candidates enter at initial identification and pass through pre-screening, referral to a site, appointment booking, screening, eligibility determination, and consent. Every stage loses candidates. That is normal. What matters is which stage is losing more than it should, and whether the loss is concentrated at a point that can be addressed.
Enrollment counts hide the funnel. Aggregate drop-off rates hide which trial and which site is driving the aggregate. Useful visibility is stage-by-stage, held against a baseline of healthy funnel behavior, and disaggregated to the trial and site level.
Screening to enrollment is the most common concentration point. A rising screen failure rate, or one that varies sharply between sites running the same protocol, is a signal. Either pre-screening is letting through candidates who should not have reached the site, or a criterion is being applied differently across sites. Both are addressable when the signal surfaces in weeks rather than quarters. Reducing screen failures in clinical trials examines how earlier funnel visibility changes what sites and sponsors can do about it.
Site-level variance surfaced early enough to act on
Site performance is never a smooth distribution around a mean. It is a small number of sites carrying disproportionate enrollment, a middle group performing near plan, and a tail falling behind. Averaged across the portfolio, this looks acceptable. Broken out site by site, it identifies the specific relationships that need attention.
Enrollment count by site is not enough. The variance sponsors need is the funnel by site: referrals received, appointments booked, screenings completed, screen failures, randomizations. A site with strong referral volume and weak conversion has a different problem than a site with low referral volume and high conversion. The interventions are different. Neither is visible when the dashboard averages across sites.
Timing matters as much as granularity here. A dashboard that flags site variance in month eight narrows the response options to escalation. A dashboard that flags the same variance in month three preserves the option to add outreach, reassign candidates, or bring on a compensating site. Why clinical trial recruitment is still stuck traces how site-level variance goes unaddressed when the systems around it are built for reporting cadence rather than intervention cadence.
Diversity and representativeness while the trial is still enrolling
Enrollment composition has historically been a reporting output. The final analysis includes a breakdown by demographic and clinical characteristics. If the composition is off from the protocol target, it is documented and discussed after the fact.
The reason it was a reporting output is that the data used to arrive monthly. When composition data is visible in near real time, it stops being a rear-view metric and becomes a recruitment input. A dashboard that shows current composition against target, tracked continuously through the enrollment period, gives sponsors the option to shift outreach, work through different community partners, or amend the protocol before the composition problem is locked in.
What sponsors do with this visibility varies by trial. What they cannot do is respond to a composition problem they first see in the final analysis. What sponsors should look for in a recruitment platform addresses how recruitment infrastructure either supports or blocks mid-trial adjustment.
Alerts tied to deviations, not dashboards full of green numbers
A dashboard where every metric is within tolerance is difficult to read. The eye searches for the number that changed direction. That is the number that matters.
Alerts move the pattern detection work from the sponsor to the system. Useful ones share three properties. They are tied to a specific trial and site, not the portfolio in aggregate. They describe the deviation in concrete terms: a screen failure rate crossing a defined threshold, a pre-screen completion rate dropping below the baseline, an appointment backlog exceeding a set window. And they are severity-tagged, so a sponsor scanning the portfolio can distinguish routine variance from a signal that needs action this week.
Without that layer, operational issues surface through weekly status calls. The cadence is too slow for the recruitment window, and the burden of pattern detection sits with the people least positioned to see the pattern across sites and trials.
How DecenTrialz builds recruitment visibility into sponsor workflows
The six decisions above define what the DecenTrialz sponsor view is built to support. AI-assisted participant matching and registered nurse-led pre-screening move candidates through the early stages of the funnel before they reach the research site. That matching and pre-screening activity is what generates the funnel data every stage of the sponsor view depends on.
Pace-against-plan is tracked at the portfolio and trial level, with projection forward from current trajectory. Funnel drop-off is visible stage by stage, disaggregated per trial and per site rather than rolled into an aggregate. Site variance is surfaced against comparable sites running the same protocol, so the comparison holds. Composition against target is tracked continuously through enrollment, not at the end. Deviation alerts are severity-tagged and tied to specific trials and sites, with the operational signals that most often precede recruitment slippage surfaced directly rather than buried in weekly reports.
The scope boundary is deliberate. DecenTrialz handles AI-assisted matching and nurse-led pre-screening. Final eligibility determination, informed consent, study walk-through, and enrollment stay with the research site team. The nurse pre-screens only. That boundary is what lets the dashboard surface funnel-stage data cleanly, because each stage has a clear owner. Sponsors interested in seeing this against their own portfolio can review the DecenTrialz platform directly.
Closing the visibility gap in recruitment
Real-time recruitment visibility is not a dashboard feature. It is a decision structure. The value comes from surfacing the specific information a sponsor needs while the recruitment window is still open, at enough resolution to identify the trial, site, and stage where the problem is concentrated. Sponsors evaluating recruitment infrastructure for upcoming studies can start with DecenTrialz.
Was this article helpful?

Similar Blogs

Clinical Trial Patient Matching: Why Do Sponsors Need More Than a Public Registry Listing?
Every applicable clinical trial conducted in the United States must be registered in the f...
 Swaroop ESD
DecenTrialz vs traditional recruitment platforms: how does full-service matching differ from self-service trial search?
Comparisons between DecenTrialz and traditional recruitment platforms usually come down to...
Vamshi Kantoju
RN-led pre-screening in clinical trials: what does nurse review add that AI matching cannot?
Artificial intelligence has changed how quickly clinical trial candidates can be identifie...
Deeksha GittaStay Informed. Stay Connected.
Get updates on verified clinical trials, emerging treatments, and research breakthroughs directly in your inbox. No spam, just science that matters.
